Coding da Vinci - Berlin 2017
Since its inception in 2014, the culture hackathon Coding da Vinci has brought together the cultural sector with creative technology communities to explore the creative potential of digital cultural heritage. Over a several-week sprint phase hackathon teams, together with representatives of cultural institutions, develop working prototypes --for example apps, websites, data visualisations, games or interactive installations-- that show surprising and inspiring new ways to communicate and make use of institutions' collections and artifacts in the digital age.
Das Coding da Vinci-Playbook
Step by step to your own culture hackathon
Coding da Vinci has become a movement for open cultural data: Become a part of it now!
With the Coding da Vinci Playbook, you can run your own culture hackathons. It works like a cookbook: try out the whole menu, individual courses, or just certain ingredients - according to your taste. Benefit from many years of experience from a total of 14 Coding da Vinci editions, which guides you step by step through the organization of the entire process - from the provision of data to the creative "magic moment" of the kick-off to the presentation of the results.
The potential of open cultural data
... is shown by the creative digital projects made by, to date, over 2000 hackathon participants, on the basis of hundreds of datasets contributed by almost 200 cultural institutions.

362 Institutions

488 Data sets

217 Projects
Projects
All apps, websites, data visualizations, games, interactive installations and even hardware developed at Coding da Vinci on the basis of open cultural data are available here permanently and under open licenses.
Out of competition
Rolling Stone
Webseite, die spielerisch und informativ den Weg, den Steine in Millionen Jahren von Skandinavien nach Mitteleuropa zurücklegten, nachzeichnet
Event
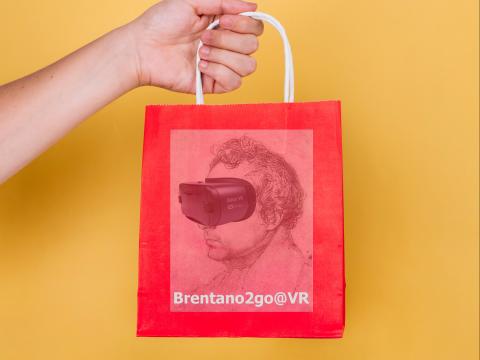
Brentano2go@VR
Interaktive 360-Grad-VR-Erlebnislesung von Brentanos Brief
Event
Most technical
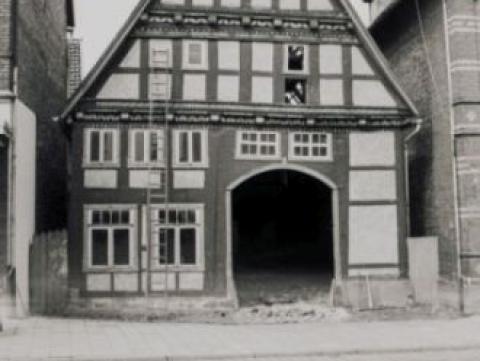
[Blomberg] VARsetzen | AR-Teil
Die Fachwerkstruktur des Hauses Blomberg und dessen Translozierung wird mittels Augmented Reality visualisiert und greifbar gemacht.
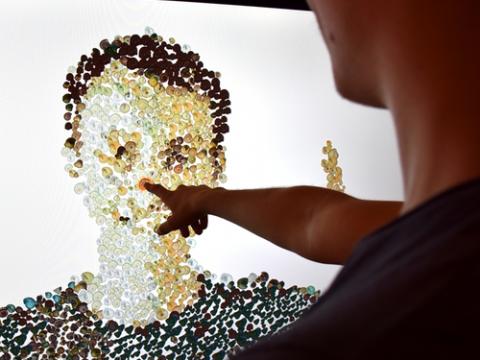
#halligallipairs
Aus 395 Objekten des Naturkundemuseums Stuttgart sind 68 fotografisch festgehalten: aus diesen entsteht das fantastische Paare-Spiel #halligallipairs
Mylius Spuren
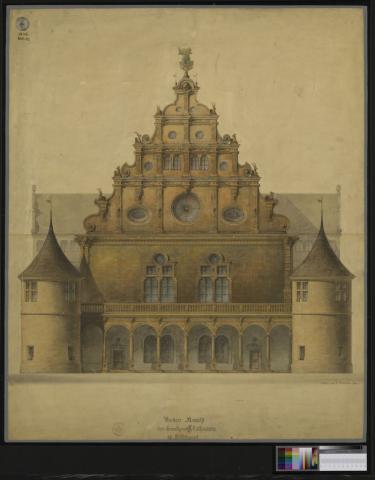
Mylius‘ historische Stadtansichten Frankfurts werden mit Geschichten und heutigen Ansichten der Stadt verbunden
Event
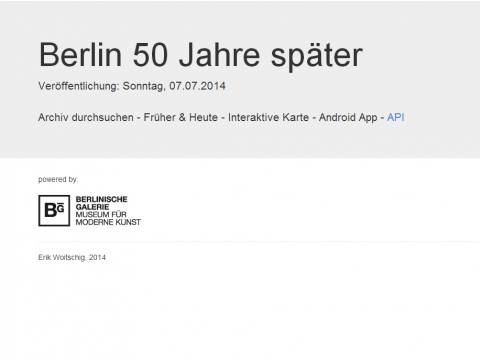
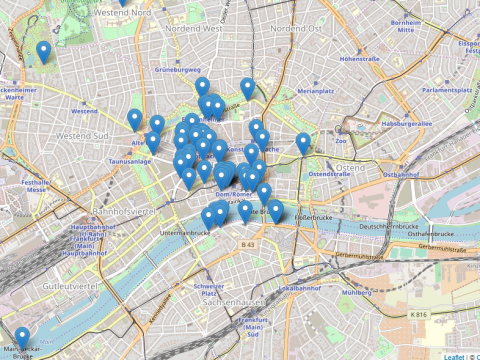
Berlin - 50 Jahre später
Vorher-/Nachher-Vergleich von Aufnahmen Ostberlins aus den Jahren 1965 und 2014
Event
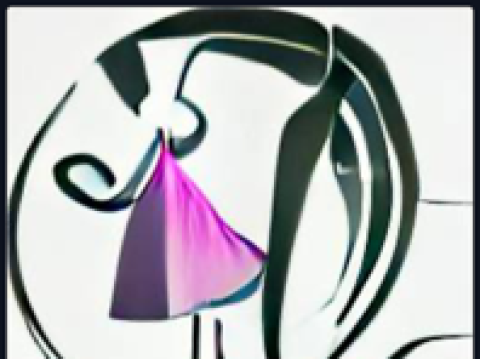
ArtXFashion AI Designer
Dein Lieblingskunstwerk nicht nur im Kopf, sondern auch am Körper behalten.

GarGOyle
Helft dem kleinen Dämonen Samy ins Münster zu kommen und lernt dabei mehr über das Freiburger Münster, seine Wasserspeier und die Stadt Freiburg!
Best design

47 Rōnin
Die Geschichte der 47 Rōnin auf japanischen Querrollen soll in einem Spiel zum Leben erweckt werden.
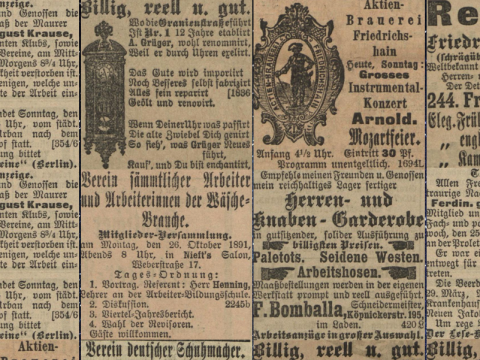
Kleinanzeigen aus dem Vorwärts von 1891
Einblicke in das Alltagsleben im sozialdemokratischen Milieu vor 130 Jahren
Most technical
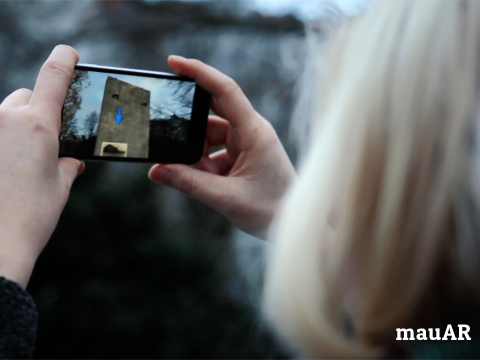
Berliner MauAR
Die Berliner Mauer ersteht mit Augmented Reality vor Ort wieder auf
Event
Best design
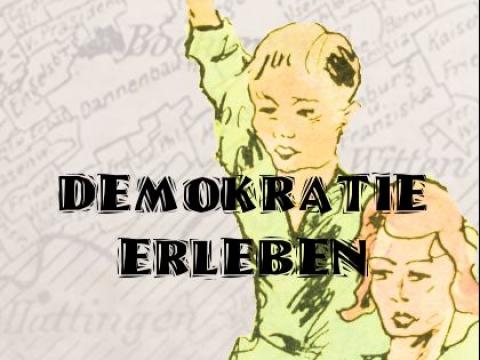
Demokratie erLeben
Website für alle, die sich spielerisch mit dem Thema Kinderrepubliken als Form früher, praktischer Demokratiebildung beschäftigen wollen
Everybody's darling
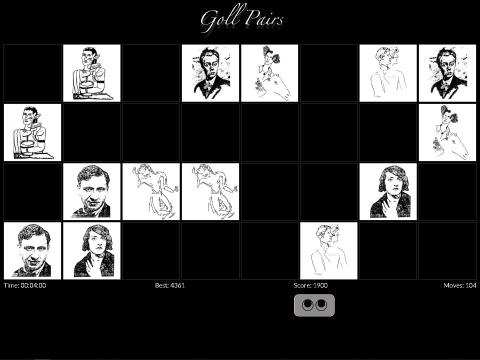
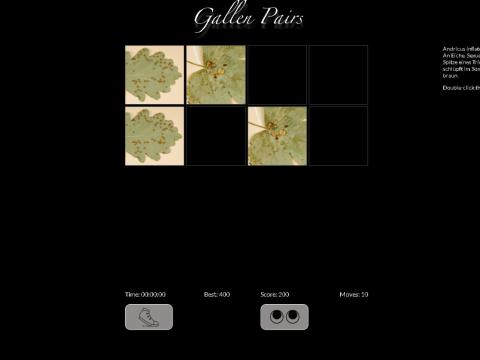
Goll Pairs
Un jeu de paires qui immerge les joueur.se.s profondemment dans les vies du couple artistique Claire et Yvan Goll
Event
Everybody's darling
Radikale Gespräche
„Radikale Gespräche“ präsentiert eine historische Zeitspanne radikaler Veränderungen in einem spannenden und gesprächsbasierten Kartenspiel.
Event
Altpapier
Nachrichten-App mit historischen Zeitungsmeldungen
Event
Daten
The digital treasures that more than 350 cultural institutions have made available to Coding da Vinci over the years remain open for reuse - all under free licenses, of course.
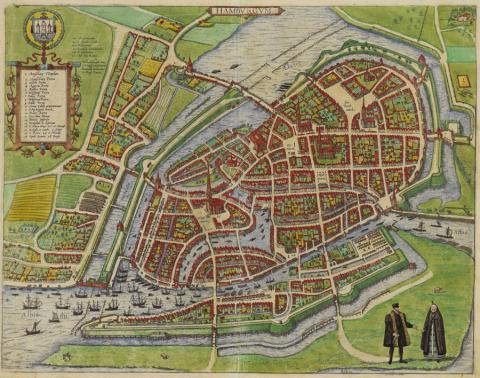
Historische Hamburg- und Elb-Karten 1588 – 1939
Staats- und Universitätsbibliothek Hamburg Carl von Ossietzky
Veranstaltung
Veranstaltung
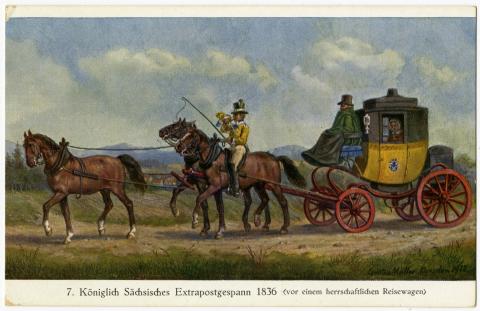
Bild


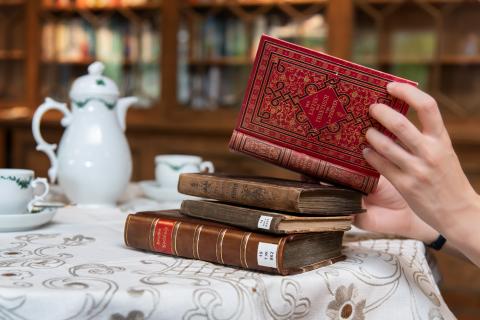
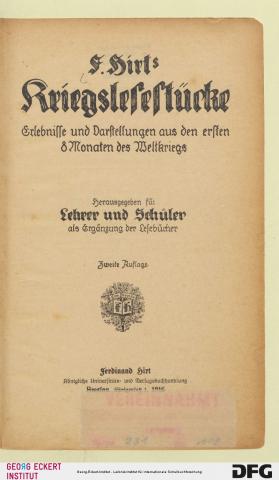
Lesebücher Deutsches Kaiserreich
Georg-Eckert-Institut – Leibniz-Institut für internationale Schulbuchforschung
Veranstaltung
Text
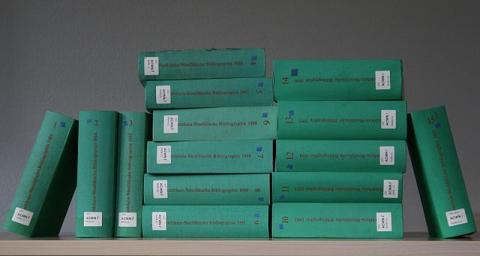
Nordrhein-Westfälische Bibliographie (NWBib)
Hochschulbibliothekszentrum des Landes Nordrhein-Westfalen
Veranstaltung
Text
Ton
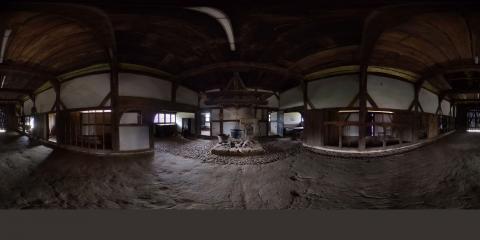
360-Grad-Aufnahmen aus dem Freilichtmuseum Molfsee
Freilichtmuseum Molfsee - Stiftung SH Landesmuseen Schleswig-Holstein
Veranstaltung
Bild